RÉSULTATS DE L’ENQUÊTE RÉALISÉE
PAR LE PROJET « ENDINGS »
Building Sustainable Digital Humanities Projects
Construire des projets durables en humanités numériques
The Project Endings global online survey was conducted between 2017 and 2018. The
Call for Participation was sent out over DH-Listservs in English in 2017, and 127
respondents accessed the online form, and all participants were free to answer or
not answer
individual questions. Of the total group, respondents were given
the opportunity to self-identify as being interested in an hour-long interview with
more detailed questions. Of that group, 25 people from different DH projects were
interviewed.
The following anonymized results are from the online form only (original survey link). Any written answers have been omitted to preserve anonymity.
Une enquête mondiale en ligne a été menée entre 2017 et 2018. L'appel à participation
a été envoyé sur DH-Listservs en anglais en 2017, et 127 répondants ont accédé au
formulaire en ligne ; tous les participants étaient libres de répondre ou non aux
questions individuelles. Sur l'ensemble du groupe, les répondants ont eu la possibilité
de s'identifier comme étant intéressés par un entretien d'une heure avec des questions
plus détaillées. Sur ce groupe, 25 personnes issues de différents projets de DH ont
été interrogées. Les résultats anonymes suivants proviennent uniquement du formulaire
en ligne lien vers l'enquête originale. Les réponses écrites ont été omises pour préserver l'anonymat.
The total number of participants in the survey was 127; however, there were no "required"
answers, so
each question has a different number of respondents, and percentages are calculated
based on the number of actual respondents in each case.
Le nombre total de participants au sondage était de 127 ; cependant, il n'y avait
pas de réponses "obligatoires", de sorte que chaque question a un nombre différent
de répondants, et les pourcentages sont calculés sur la base du nombre de répondants
réels dans chaque cas.
[Étant donné que le sondage a été effectué uniquement en anglais, nous avons décidé
de ne pas le traduire en français pour éviter de donner une impression erronée du
processus.]
General Information
1. Does your project contain born-digital material?
Answer
Count
Percentage
Yes (Y)
78
73.58%
No (N)
23
21.70%
No answer
5
4.72%
2. Does your project contain material that exists in another medium?
Answer
Count
Percentage
Yes (Y)
71
75.53%
No (N)
17
18.09%
No answer
6
6.38%
3. What year did your project begin? (If you have led more than one project, please
choose one.)
Answer
Count
Percentage
1980-1990
3
3.37%
1990-1995
2
2.25%
1996-2000
7
7.87%
2001-2005
9
10.11%
2006-2010
23
25.84%
2011-2016
43
48.31%
No answer
2
2.25%
4. What year did your project end?
Answer
Count
Percentage
1980-1990
0
0.00%
1990-1995
0
0.00%
1996-2000
0
0.00%
2001-2005
0
0.00%
2006-2010
9
10.11%
2011-2015
12
13.48%
2016-2017
13
14.61%
Still in progress
52
58.43%
No answer
3
3.37%
5. What career stage were you at when you began your digital project?
Answer
Count
Percentage
Graduate student
20
23.26%
Post-doctoral or research fellow/affiliate
9
10.47%
Independent scholar
2
2.33%
Unemployed or underemployed
1
1.16%
Early career
11
12.79%
Pre-tenure
14
16.28%
Tenured
17
19.77%
Retired and/or Emeritus
1
1.16%
Research chair
0
0.00%
Director or manager
10
11.63%
Other
2
2.33%
6. What type of institution were you in (according to Maclean's categories) when
you began the project?
Answer
Count
Percentage
Primarily Undergraduate
13
15.66%
Comprehensive
48
57.83%
Medical Doctoral universities
14
16.87%
Other
7
8.43%
No answer
1
1.20%
7. What type of institution are you in now?
Answer
Count
Percentage
Primarily Undergraduate
9
11.11%
Comprehensive
49
60.49%
Medical Doctoral universities
12
14.81%
Other
9
11.11%
No answer
2
2.47%
8. Is your project data still available online?
Answer
Count
Percentage
Yes (Y)
60
74.07%
No (N)
19
23.46%
No answer
2
2.47%
If yes, please provide a URL: [OMITTED TO PRESERVE ANONYMITY]
9. Is your project:
Answer
Count
Percentage
Ongoing (A1)
43
56.58%
Complete (A2)
18
23.68%
Dormant (A3)
10
13.16%
Abandoned (A4)
4
5.26%
No answer
1
1.32%
Your Project
10. Did you have a precise timeline for accomplishing the project from the outset?
Answer
Count
Percentage
Yes (Y)
30
40.00%
No (N)
44
58.67%
No answer
1
1.33%
11. Were you able to stick to it? [the timeline]
Answer
Count
Percentage
Yes (Y)
14
46.67%
No (N)
16
53.33%
No answer
0
0.00%
12. Is your project complete?
Answer
Count
Percentage
Yes (Y)
26
34.67%
No (N)
47
62.67%
No answer
2
2.67%
12_1. Does your project have a projected endpoint?
Answer
Count
Percentage
Yes (Y)
19
40.43%
No (N)
28
59.57%
No answer
0
0.00%
13. As you were planning your project, which of the following did you consider?
(Check all that apply.)
Answer
Count
Percentage
Research questions
64
86.49%
Timelines
47
63.51%
Endpoint
32
43.24%
Capturing metadata
44
59.46%
Documentation
53
71.62%
Where and how it was going to be archived
43
58.11%
Long-term formats
41
55.41%
Benchmarks for assessing progress towards completion
24
32.43%
Long-term users and use of your project
48
64.86%
Intellectual property issues
51
68.92%
Open access
56
75.68%
Sustainability
47
63.51%
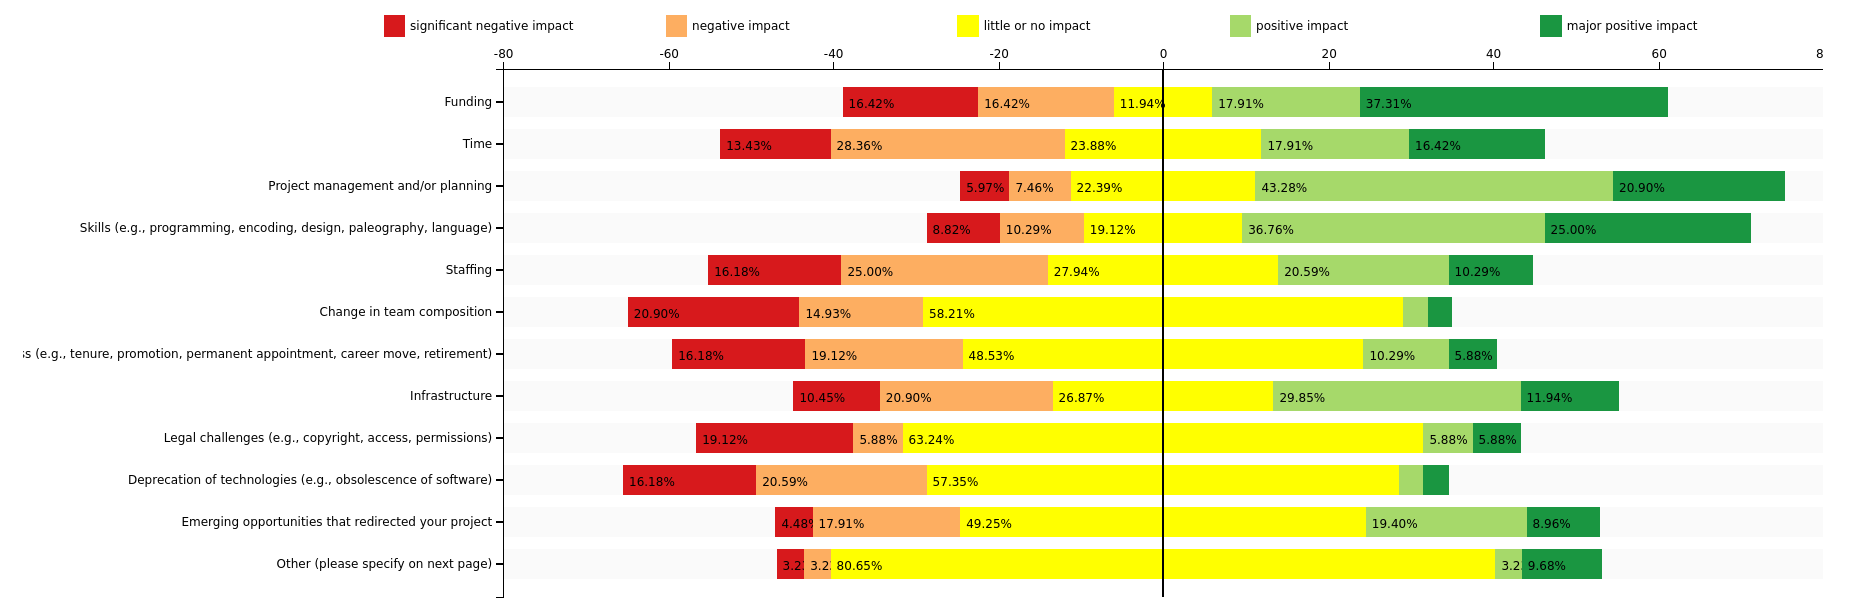
14. How much did the following factors help or hinder completion (or timely completion)
of your project? 1 = had a significant negative impact upon completion. 2 = had a
negative impact upon completion. 3 = had little or no impact upon completion. 4 =
had a positive impact upon completion. 5 = had a major positive impact upon completion.
15. Where is it archived?
Answer
Count
Percentage
At a stable and currently accessible URL
10
76.92%
In an institutional repository
5
38.46%
On GitHub
3
23.08%
In a discipline-specific repository (e.g., NINES, OLAC, etc.)
1
7.69%
Other
2
15.38%
16. Did your project have a long-term preservation plan from the beginning of the
funding cycle?
Answer
Count
Percentage
Yes (Y)
31
43.66%
No (N)
38
53.52%
No answer
2
2.82%
17. Did a campus partner offer support for long term project preservation?
Answer
Count
Percentage
University Libraries
19
26.76%
University Systems
10
14.08%
Humanities Computing
6
8.45%
I didn't ask any campus partners for help
16
22.54%
I asked, but there were no campus departments that could help
8
11.27%
Other
14
19.72%
18. Which major technologies did your project use? (Check all that apply.)
Answer
Count
Percentage
SQL database
22
30.99%
PHP
14
19.72%
XML / XSLT / XQuery
27
38.03%
Javascript
21
29.58%
Drupal
11
15.49%
Wordpress
13
18.31%
Fedora (e.g., Islandora)
3
4.23%
Other
29
40.85%
19. Which file formats were part of your final project output? (Check all that apply.)
Answer
Count
Percentage
HTML
48
67.61%
PDF
32
45.07%
JPGs
46
64.79%
TIFFs
22
30.99%
MP4s
16
22.54%
MP3s
16
22.54%
TXT
13
18.31%
JSON
10
14.08%
word processor files
13
18.31%
spreadsheets or CSV
26
36.62%
XML
27
38.03%
Other
14
19.72%
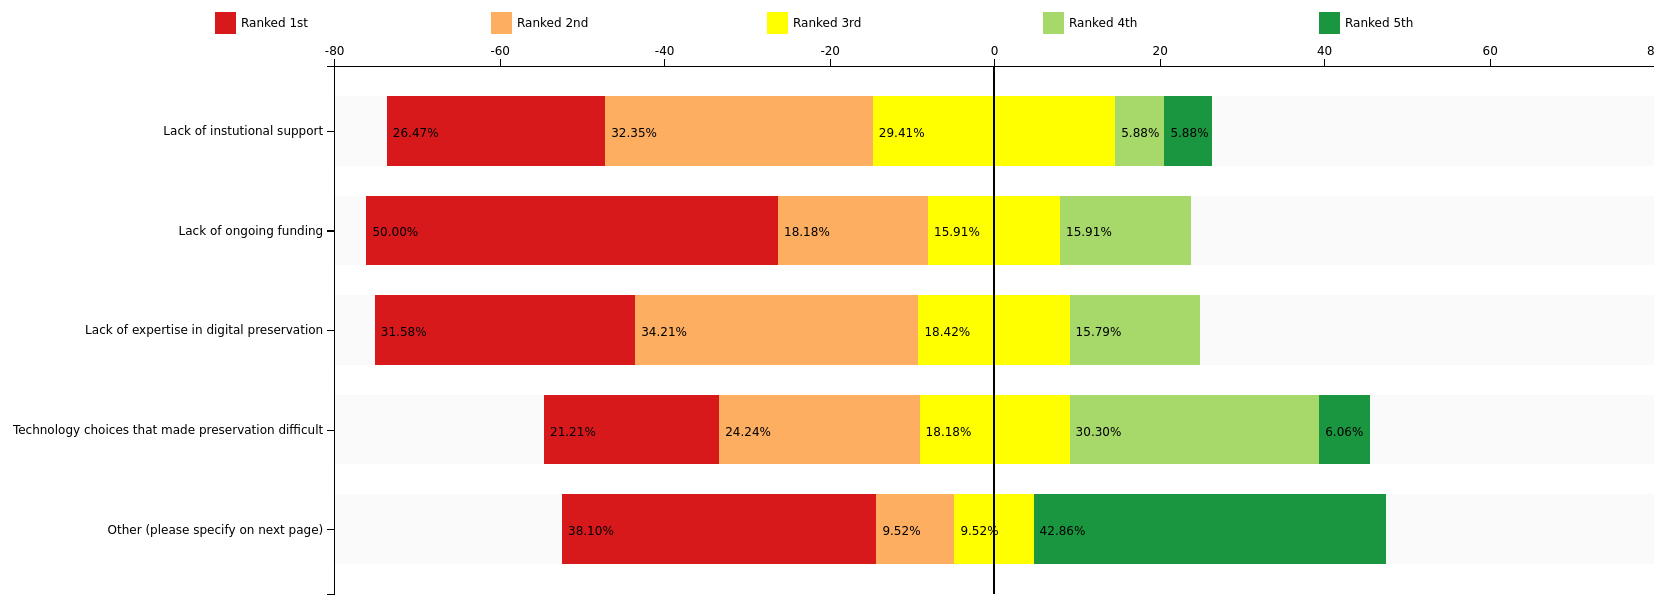
20. What were the significant obstacles to long term preservation? Please rank them
in order.
21. Which of the following standardized data models did you use in your project?
(Check all that apply.)
Answer
Count
Percentage
Dublin Core
19
27.14%
MODS
5
7.14%
TEI
17
24.29%
RAD
1
1.43%
EAD
0
0.00%
DocBook
0
0.00%
DDI
0
0.00%
I created my own data model
18
25.71%
Other
14
20.00%
22. Did your project clearly document your data model?
Answer
Count
Percentage
Documentation of relational database and table structure
15
21.74%
Documentation of field names and definitions
28
40.58%
Documentation of controlled vocabularies and valid field values
26
37.68%
Other
20
28.99%
23. Did you have clear licensing and rights statements for all of the material in
your project?
Answer
Count
Percentage
Yes, documented publicly (A2)
26
37.68%
Yes, documented privately (A3)
12
17.39%
For most material but not all (A4)
9
13.04%
For some material (A5)
9
13.04%
Other
7
10.14%
No answer
6
8.70%
24. Is your project data archived somewhere offline?
Answer
Count
Percentage
Yes (Y)
44
63.77%
No (N)
22
31.88%
No answer
3
4.35%
24_1. If Yes, Where?
Answers omitted to preserve anonymity
25. If your project is still online, who is responsible for ongoing maintenance
(software updates, security patches, hardware replacement)?
Answer
Count
Percentage
University Systems
13
18.84%
Library
9
13.04%
Humanities Computing
7
10.14%
PI
18
26.09%
Project is not being actively maintained
13
18.84%
Not applicable
7
10.14%
Other
14
20.29%
26. Are the tools and libraries used in the project:
Answer
Count
Percentage
All free and open-source (A2)
36
53.73%
All proprietary and closed-source (A3)
1
1.49%
A mixture of open and closed (A4)
27
40.30%
No answer
3
4.48%
27. Have any parts of the project output stopped working due to software obsolescence?
Answer
Count
Percentage
Yes (Y)
15
22.39%
No (N)
49
73.13%
No answer
3
4.48%
27_1. If yes, please provide some details:
Answers omitted to preserve anonymity
28. If a new developer had to pick up this project five years from now and extend
it, how do you think they would describe the technical documentation?